
A key challenge for e-commerce businesses is to analyze the trend in the market to increase their sales. The trend can be easily observed if the companies can group the customers; based on their activity on the e-commerce site. This grouping can be done by applying different criteria like previous orders, mostly searched brands and so on.
Given the e-commerce data, use k-means clustering algorithm to cluster customers with similar interest.
| Column | Description |
|---|---|
| Cust_ID | Unique Numbering of Customers |
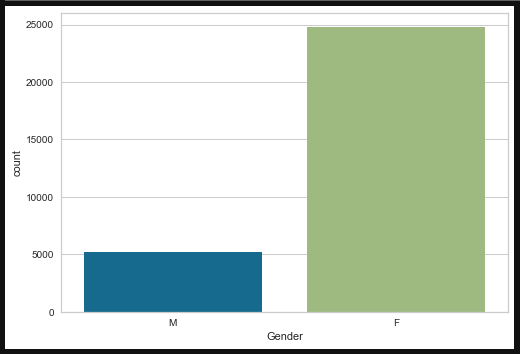
| Gender | Gender of Customer |
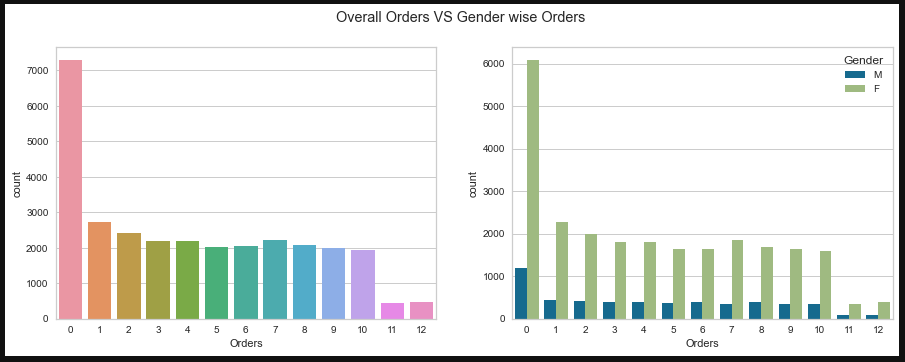
| Orders | No. of Past orders placed by the customers |
Remaining 35 features (brands) contains the number of times customers have searched them.
- First Import the necessary libraries needed for the project. Below are the libraries that I have used
- import pandas as pd
- import numpy as np
- import matplotlib.pyplot as plt
- import seaborn as sns
- from sklearn.preprocessing import MinMaxScaler
- from sklearn.metrics import silhouette_score
- from sklearn.cluster import KMeans
- from yellowbrick.cluster import KElbowVisualizer
- Load the dataset using pandas.
- Understand the data with basic statistics, info, total records, features and their data types also number of null values.
- Perform the data cleaning techniques like treating the missing values.
- Visualize the data with the help of Matplotlib or Seaborn to get better understanding of the features.
- In my project I have used Seaborn’s
- Boxplot(To visualize the Outliers present in the data)
- Barplot (To get to 10 customer ID based on Total searches)
- Countplot (To get gender count and Prior orders count)
- Heatmap (To find the Correlation)
- Histogram (To get know how the data is distributed)
- Below are some of the charts that I have plotted


- Perform the data scaling using minmaxscaler and data will be scaled between 0 and 1.
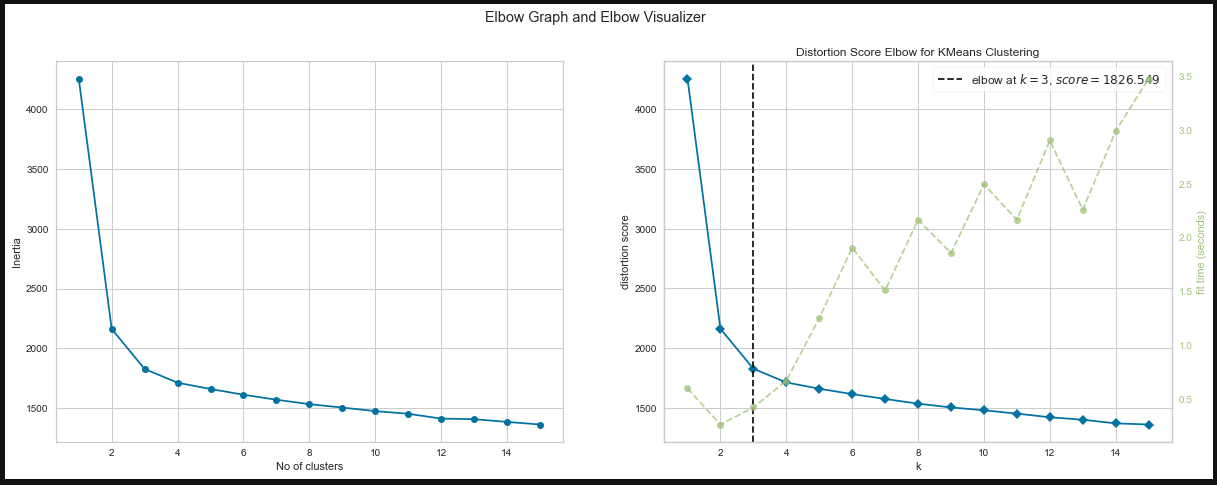
- Implement the Elbow method or Silhouette method to find the optimum number of K. Also visualize them with plots.

- After getting optimum K value use it as number of clusters and perform the model fit.
- The model will provide the output with different clusters.
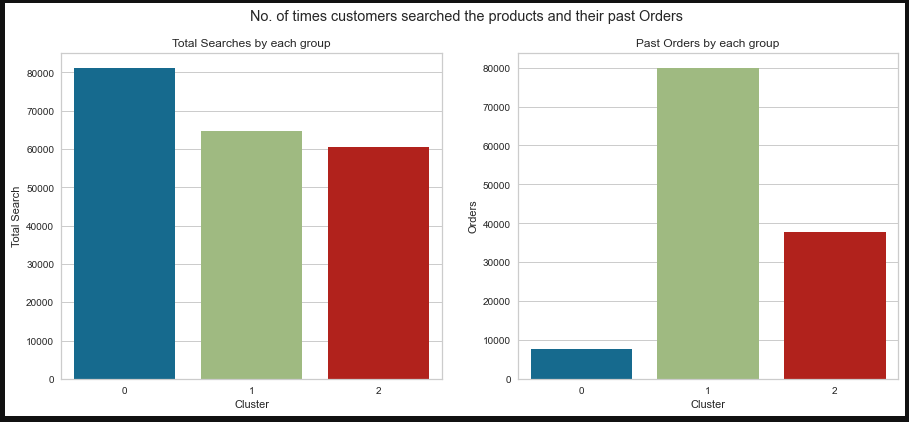
- Analyed each clusters using visualization techniques to find the insights.

- Finally I got the conclusion (Refer attached python notebook) by analyzing each clusters.
 https://github.com/sriram2098/E-commerce-Customer-Segmentation
Leave a Reply